
 Yahoo Finanzen
 Bitcoin and ETH Price Prediction: Recovery Isn’t Over Yet, TRX Could Take-off
Key Insights:
Bitcoin could rise again unless it breaks the $19,950 support.
Ether (ETH) is showing positive signs above $1,060.
TRX eyes more upsides above the $0.0665 resistance.
Bitcoin
After a short-term recovery wave, bitcoin price failed to clear the $21,750 resistance zone. BTC formed a top and started a fresh decline below the $21,000 level.
There was a clear move below the $20,600 support area and a connecting bullish trend line on the hourly chart. However, the bulls were active near the $19,950 support zone. The price is now rising above the $20,600 level and the 21 simple moving average (H1).

The first major resistance is near the $21,000 level. The main resistance sits at $21,750, above which the price could recover towards $22,800.
Ethereum (ETH)
ETH also followed a similar pattern after it failed to clear the $1,200 resistance zone. The price started a fresh decline below the $1,150 support level and the 21 simple moving average (H1).
There was a clear move below a key bullish trend line with support near $1,145 on the hourly chart. It tested the $1,060 support zone, where the bulls emerged. Ether price is now rising above the $1,100 level and the 21 simple moving average (H1).
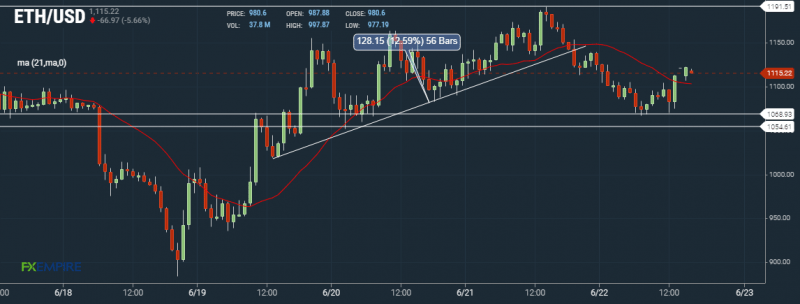
On the upside, the price could face sellers near the $1,150 and $1,155 levels. The main resistance is now near the $1,200 zone, above which the price could rally 5%-8%.
Tron (TRX)
TRX formed a strong base above the $0.0480 level and started a steady increase. There was a steady increase above the $0.0500 level.
There was a move above the 38.2% Fib retracement level of the downward move from the $0.0920 swing zone to $0.0480 low. TRX price is now trading near a key resistance at $0.0665 (the previous breakdown support).
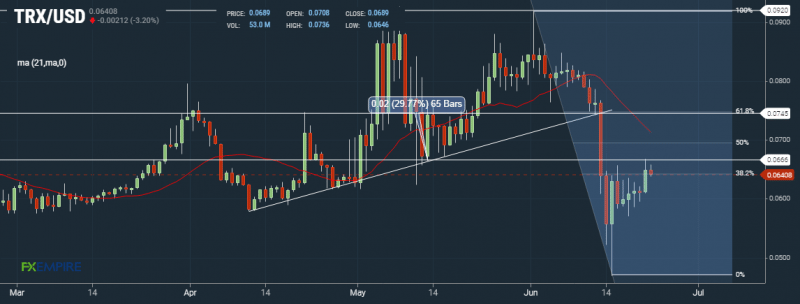
A clear move above the $0.0665 level could send the price towards the $0.0720 resistance zone or the 21-day simple moving average. Any more gains might clear the path for a surge towards the $0.0850 level.
If there is no upside break above the $0.0665 resistance, the price could trim gains and restart decline towards the $0.050 support zone.
ADA, BNB, and DOT price
Cardano (ADA) is showing a few bearish signs below the $0.500 support zone. The next major support is near $0.462, where the bulls might emerge.
Binance Coin (BNB) failed to continue higher above $225 and started a fresh decline. It seems like the bulls might make another attempt to clear $225 and $230.
Polkadot (DOT) retreated lower and settled below the $8.00 support. The next major support sits near the $7.45 level.
A few trending coins are DOGE, UNI, and WAVES. Out of these, UNI is up over 10% and eyeing more gains towards the $6.50 resistance.
This article was originally posted on FX Empire
